Thursday, January 14, 2010
Andy's blog #13
Continuing to complete my 1st draft paper on last analysis of cost risk assessment and contingency determination, I’d like to brief my research how to apply AACE Recommended Practice in the analysis as written below :
AACE International Recommended Practice No. 41R-08 describes the process known as range, a methodology to determine probability of a cost overrun and contingency needed in the estimate to achieve any desired level of confidence as follows steps :
- Identifying the critical activities and the risks
- Determining the ranges and probability density functions
- Contingency determination and probability overrun - using Monte Carlo simulation
Identifying the critical activities
The root cause analysis and the cost risk score on previous week blog#6 and blog#7 present that the major cost driver of risk category is the lower productivity of equipments which are caused some circumstances such lower physical availability of equipments, ineffective constructability, long haul distance, site complexity , rain season, etc. The variability of equipment productivity result uncertainty or risk condition that drive the overall of project activities cost have a risk to overrun. As the equipment productivity is the parameter used to calculate all activities costing and simulate a risk variable to determine a contingency of project cost.
Determining the ranges and probability density functions
Historical data of equipments productivity that have been worked in the active pit adjacent the project work area since October 2009 to December 2009 is used to determine the ranges and probability density function (distribution) of productivity parameter. The data distribution as shown Figure below shows that probability density decrease is quite symmetrically as a value move the mean where the means is equals to the median. Thus, the normal distribution standard is used as probability density function to run on the simulation.

Contingency determination and probability overrun – by Monte Carlo Simulation
A cumulative probability distribution is more commonly known as an S curve which is usually derived from a simulation such as Monte Carlo can be particularly useful in portraying the uncertainty implications of various cost estimate. While the uncertainty is described in a probability distribution modeled and the generation of statistics requires a random sampling of all possible values. The general approach to simulation using Monte Carlo method is [1] :
- Develop a cost estimate model based on work break down structure
- Select the group for analysis as cost variables
- Identify uncertainty includes select the probability distributions
- Analyze the model with simulation
- Generate reports and analyze information
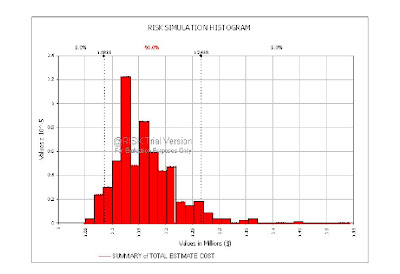

In Figure above can see the known risks of probability of project cost is range from $1.0855 M at 5 % probability of under run to $ 1.2658 M at 5% probability of overrun. The characteristic of S curve show that the gradient of slope is more gradual shape when approach more than 90 % probability, which means that increasing a certainty level up to 100 % probability would give more increasing on project cost estimated which might be not worth as preference option.
However, there is no specific guideline is considered a best practice to determine a defensible level of contingency reserves as the selection of desired probability actually depends upon the risk attitude of management. A 50% probability might be have equal probability of overrun and under run, also a risk neutral approach to overbalance the corporate capital portfolio that some projects might be overrun while others will under run. Moreover, the contingency reserves are necessary to cover increased cost resulting from uncertainty mining plan in the pit area which affect the project scope and parameter assumption, geotechnical risk, increasing fuel cost and equipment maintenance cost, low production working during rain season, and inaccurate topography data. Refer to the Corporate policy that 10 % is allowance limit for overrun and considering to make a provision for risks unknown as stated above at the time but likely appears as the project progress, a 90% probability is proposed as a desirable level of contingency reserves.
[1] Risk Management, Chapter 31, page 31.6-31.7, Allen C. Hamilton, CCE, Skill & Knowledge of Cost Engineering, 5th Edition Revised, AACE International.
I don't think there are any "rules of thumb" to guide us on what probability to use....
Speaking as a CONTRACTOR, I know that if I go over the 90% p level, I will never win any competitive bids, and if I go to 50/50, that is nothing more than gambling.....
Pragmatically, I strive for 85%. That gives me a bit to negotiate, but unless I was really desperate for work, I would not drop below 70%.
Given we have the propensity to be overly optimistic anyway, (See Chris's blog posting this week) and given that if we do make an error (as a contractor) that it more than likely will be in favor of the owner than contractor, the 70% is probably closer to the true 50%.
Keep up the good work and looking forward to seeing your paper!! SOON!!
BR,
Dr. PDG, Jakarta

Subscribe to Post Comments [Atom]
<< Home
![]()
Subscribe to Posts [Atom]
Post a Comment
Thank you very much for your comment, we will try to reply your comment as soon as possible.